Templates for Excel Charts
Sometimes I work with Excel and need to make attractive looking charts. The default charts look awful and this is often a time consuming exercise. I can spend hours recreating the same formatting in different charts by pointing an clicking. But there’s a better way to do it; using templates.
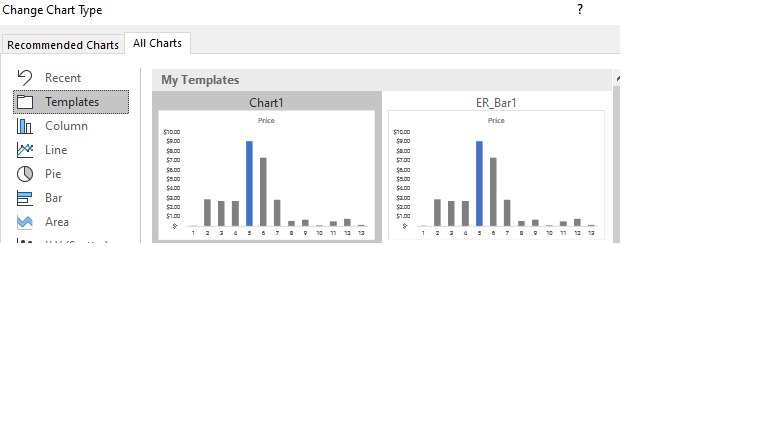
Once you’ve created a chart that you’re happy with, right click and select “Save as Template…” and give it a clear name, so when you go to select it you immediately know what it’s for. Then next time you create a chart you can use “Insert > Recommended Charts”, then click on the pane titled “All Charts” and then select “Templates” on the left navigation bar and select your template. Or you can right click on an existing chart, and select “Change Chart Type…” and then select “Templates” and choose your template form the list.
Note that the templates are files so you could copy and save them somewhere central or share them. The same templates are available in Powerpoint. Where possible try to make the charts directly in Powerpoint because it’s easier to edit them than if you copy the image of the chart (especially for people who don’t have the workbook the charts were created in).
A similar technique you can use in Office is themes. If you search for “Theme Colors” you can “Customize theme colors” (at the bottom) and select colors to have readily at hand in your default palette. Similarly you can search for “Theme Fonts” and select default fonts; unfortunately it just supports a heading font and a body font. You can then save the whole theme after searching “Themes”. One benefit of themes are you have the right fonts and colors available (I’ve spent way too much time trying to find font inconsistencies and looking up color codes). Another is if you stick to the theme palette and fonts you can easily change the look of your document by changing theme (a bit like a CSS stylesheet); this could be helpful if you wanted to customise the look of charts to suit your clients.